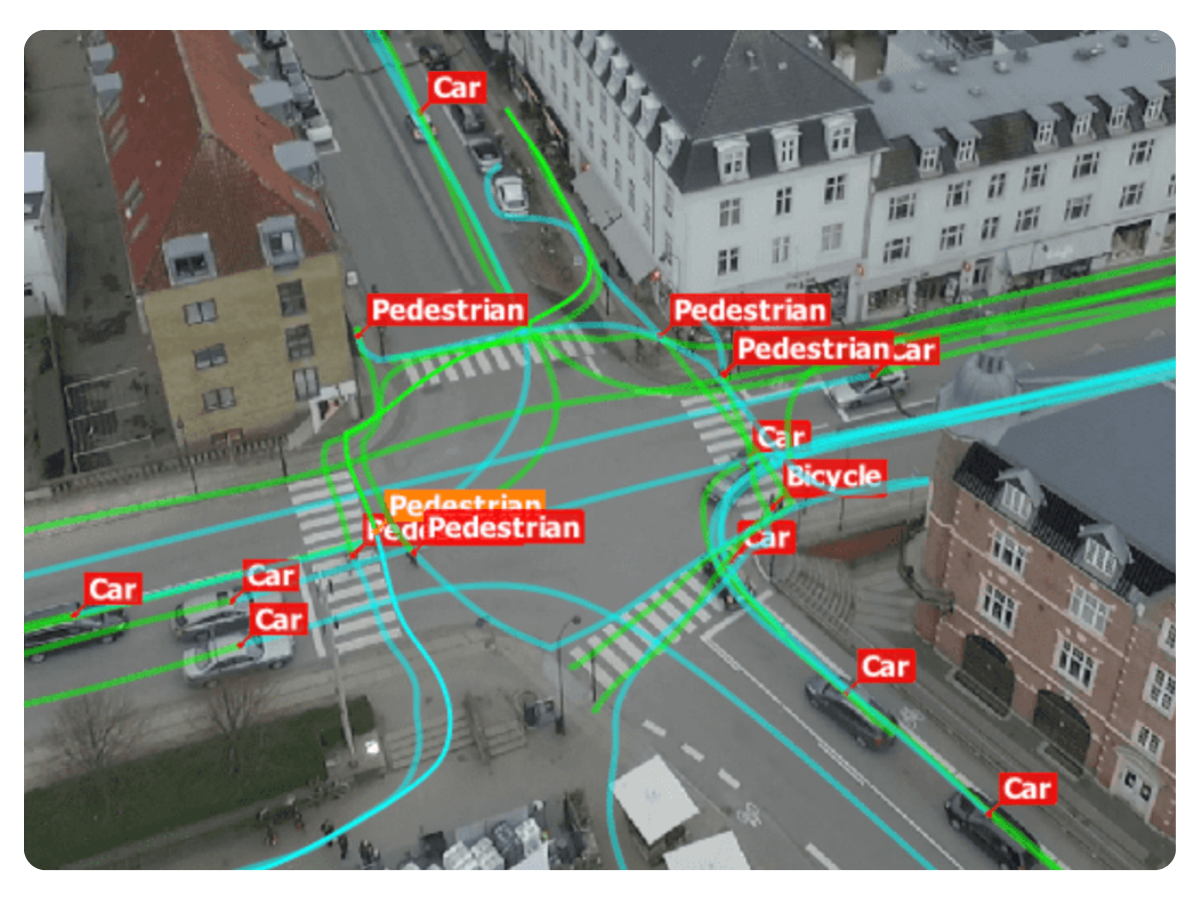
With drones and AI, we capture what pole cameras and manual studies miss — vehicle/pedestrian/bike volumes, turning paths, and hidden safety risks — delivered in GIS-ready reports.
Reqest Traffic StudyOrder Raw Data Only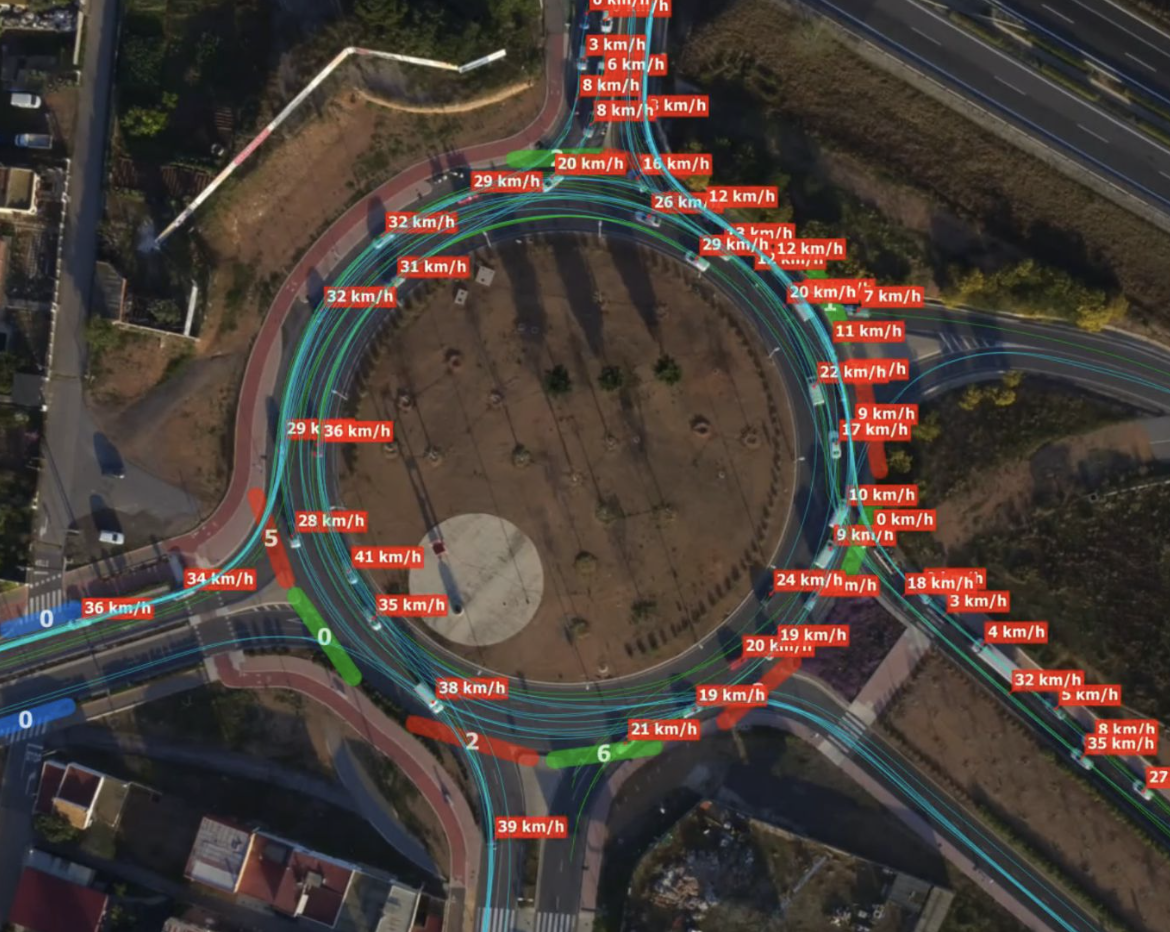
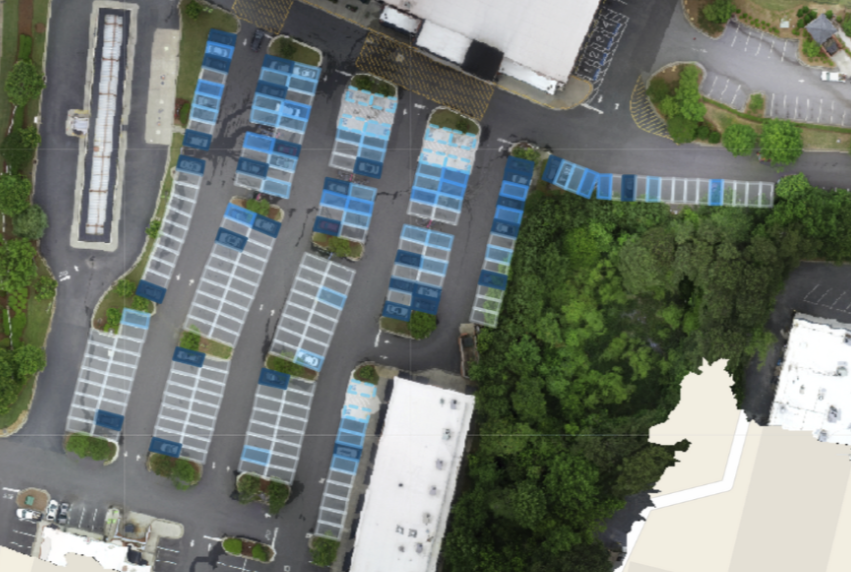
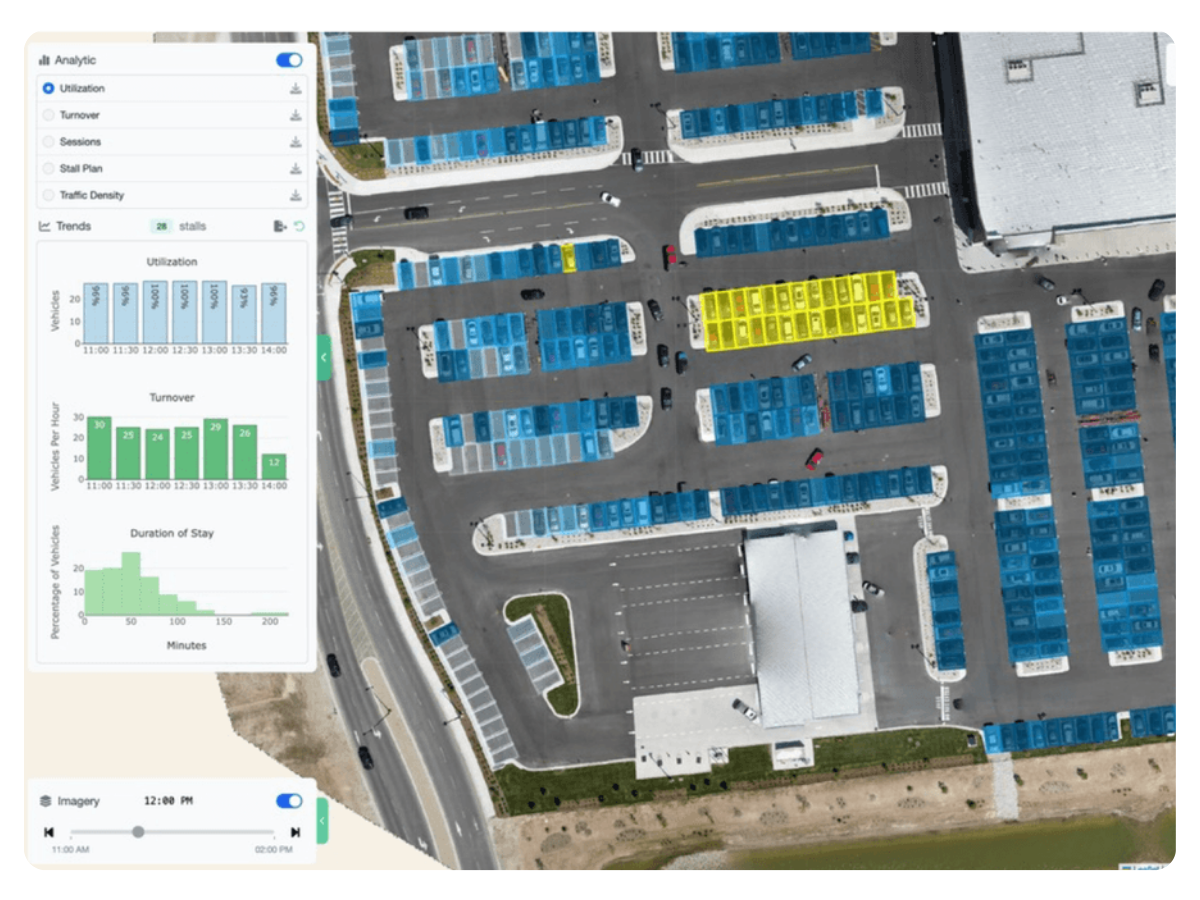
Track vehicle, truck, bike, and pedestrian flow with speed profiles.

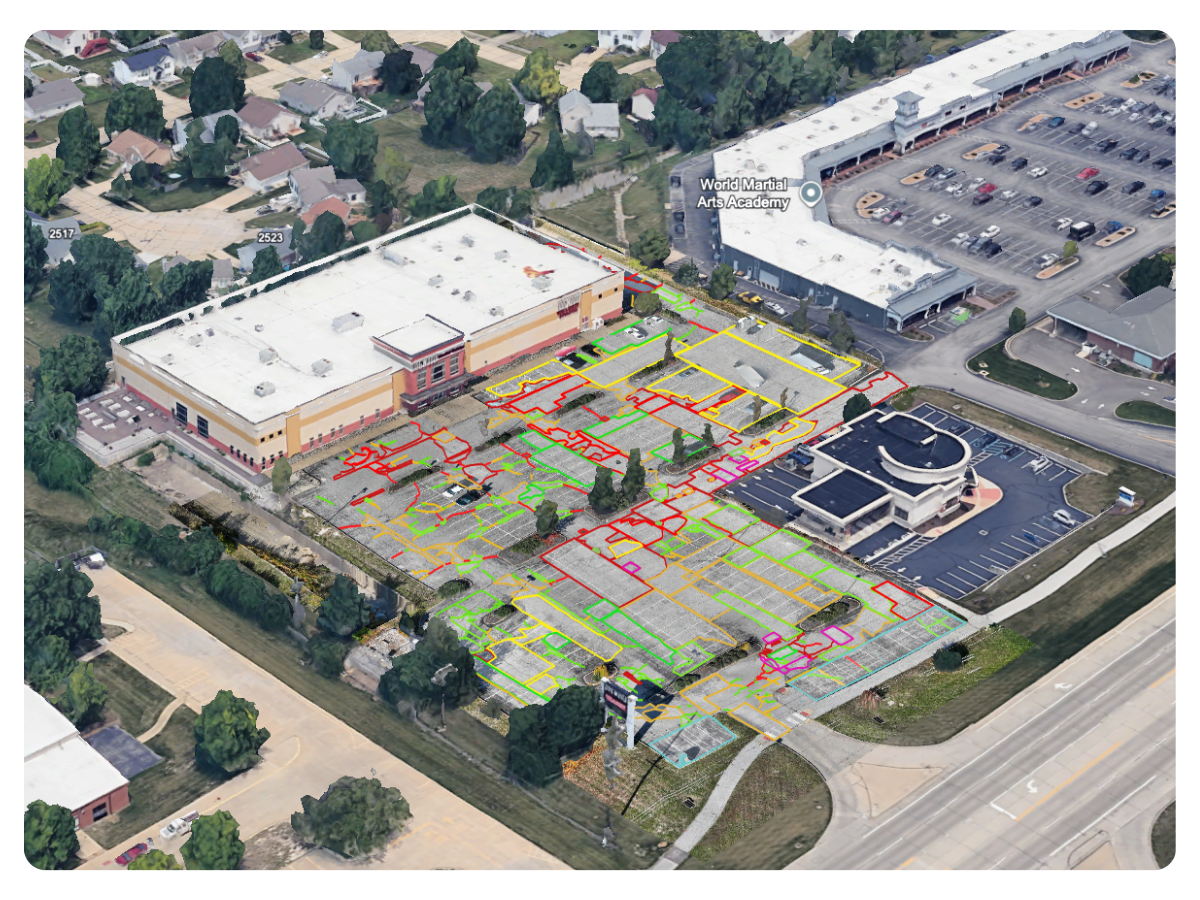
Identify and categorize movements, including near-miss events.

Map turning paths, travel lanes, and movement trajectories.
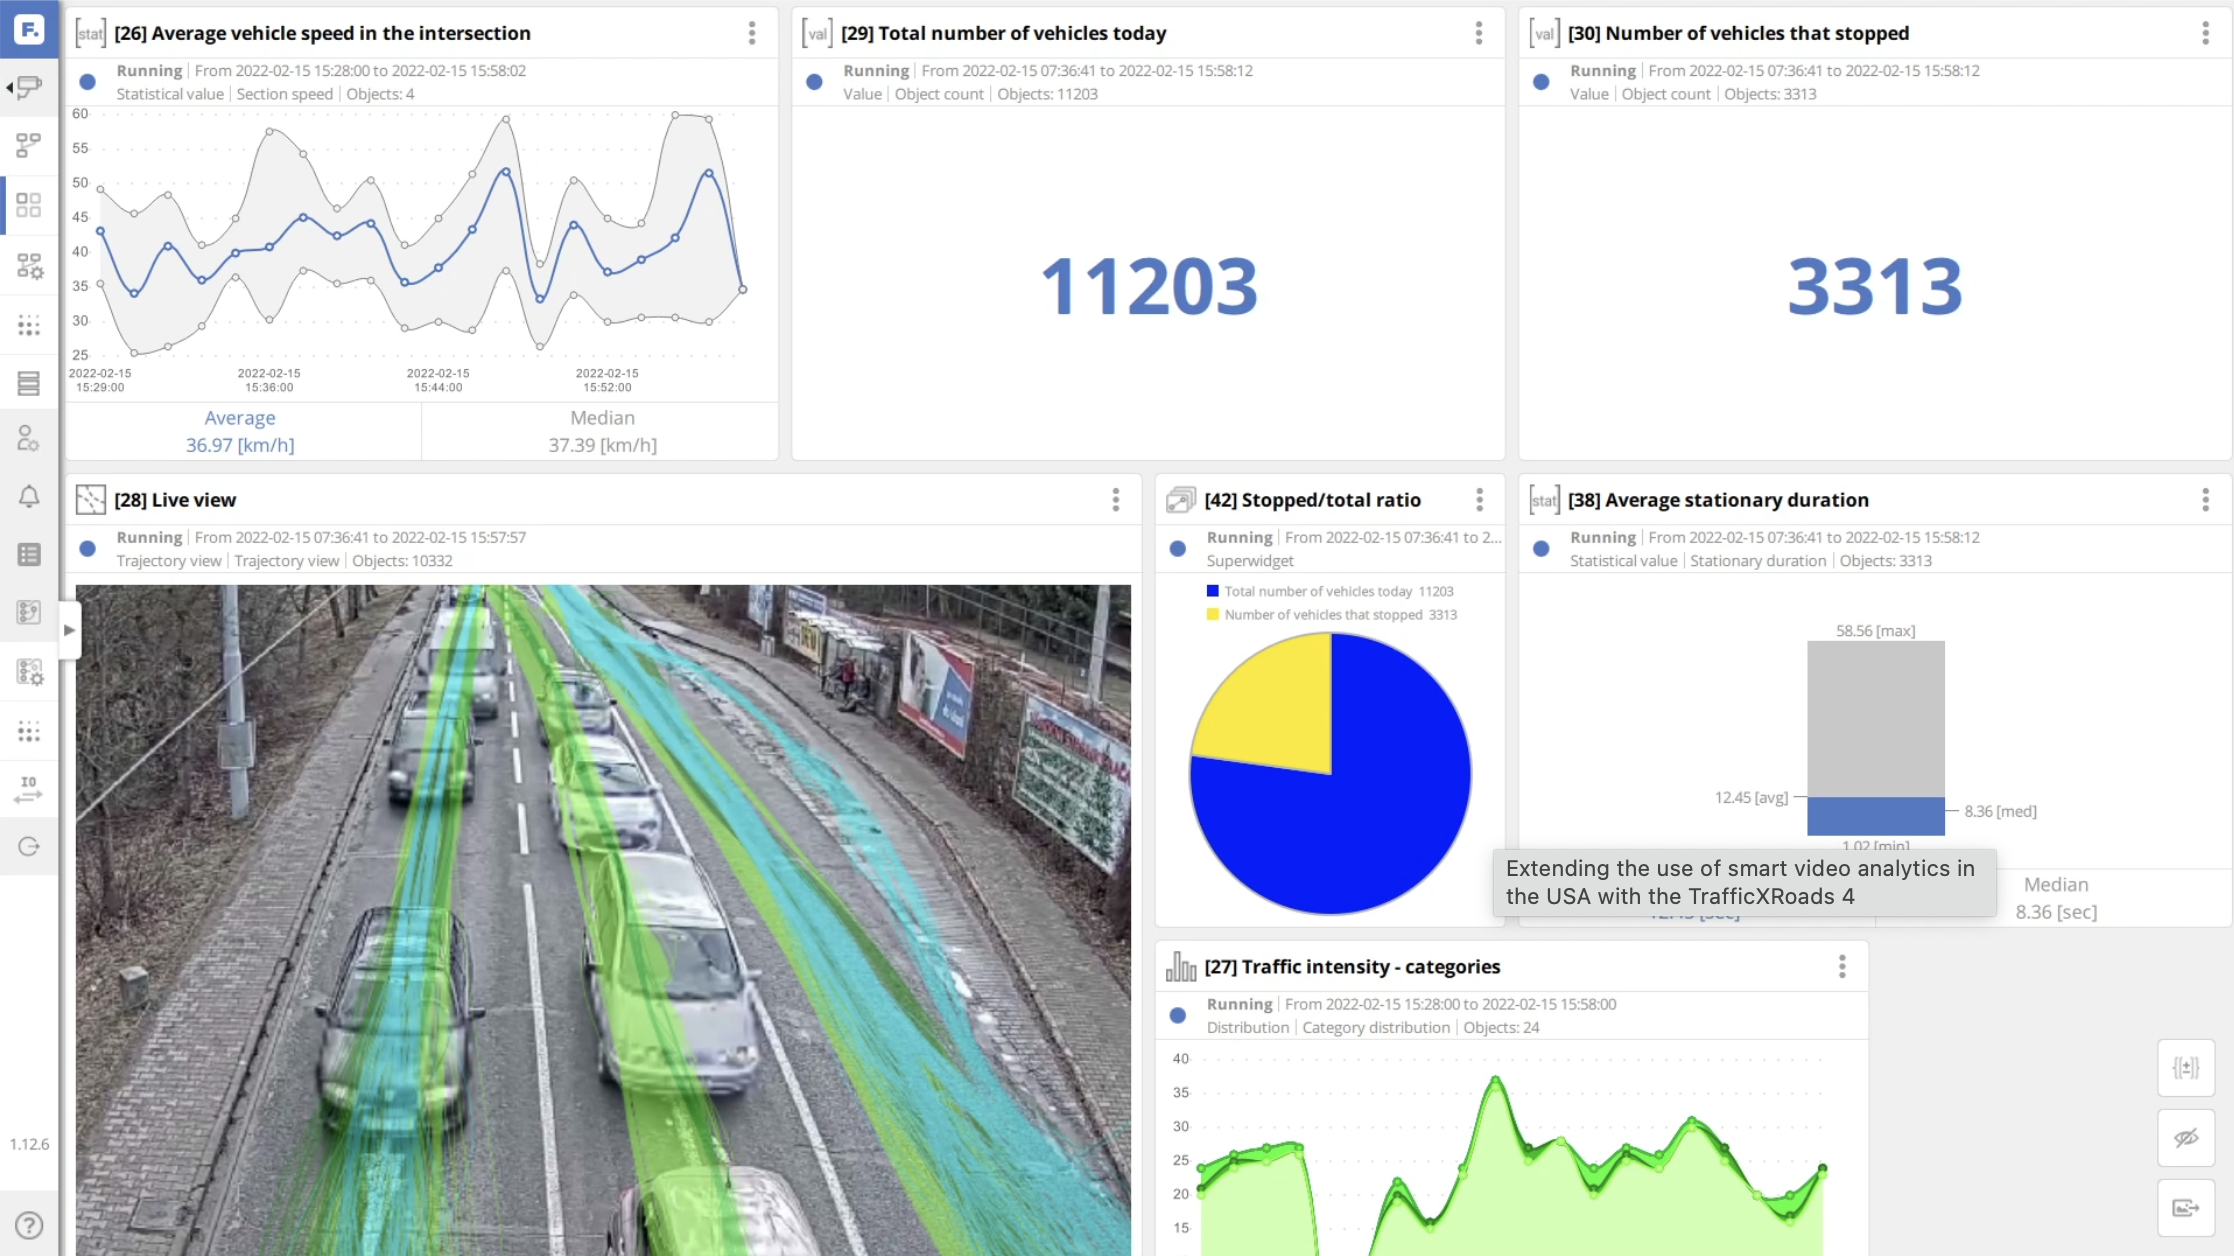
Measure intersection wait times and overall delay patterns.
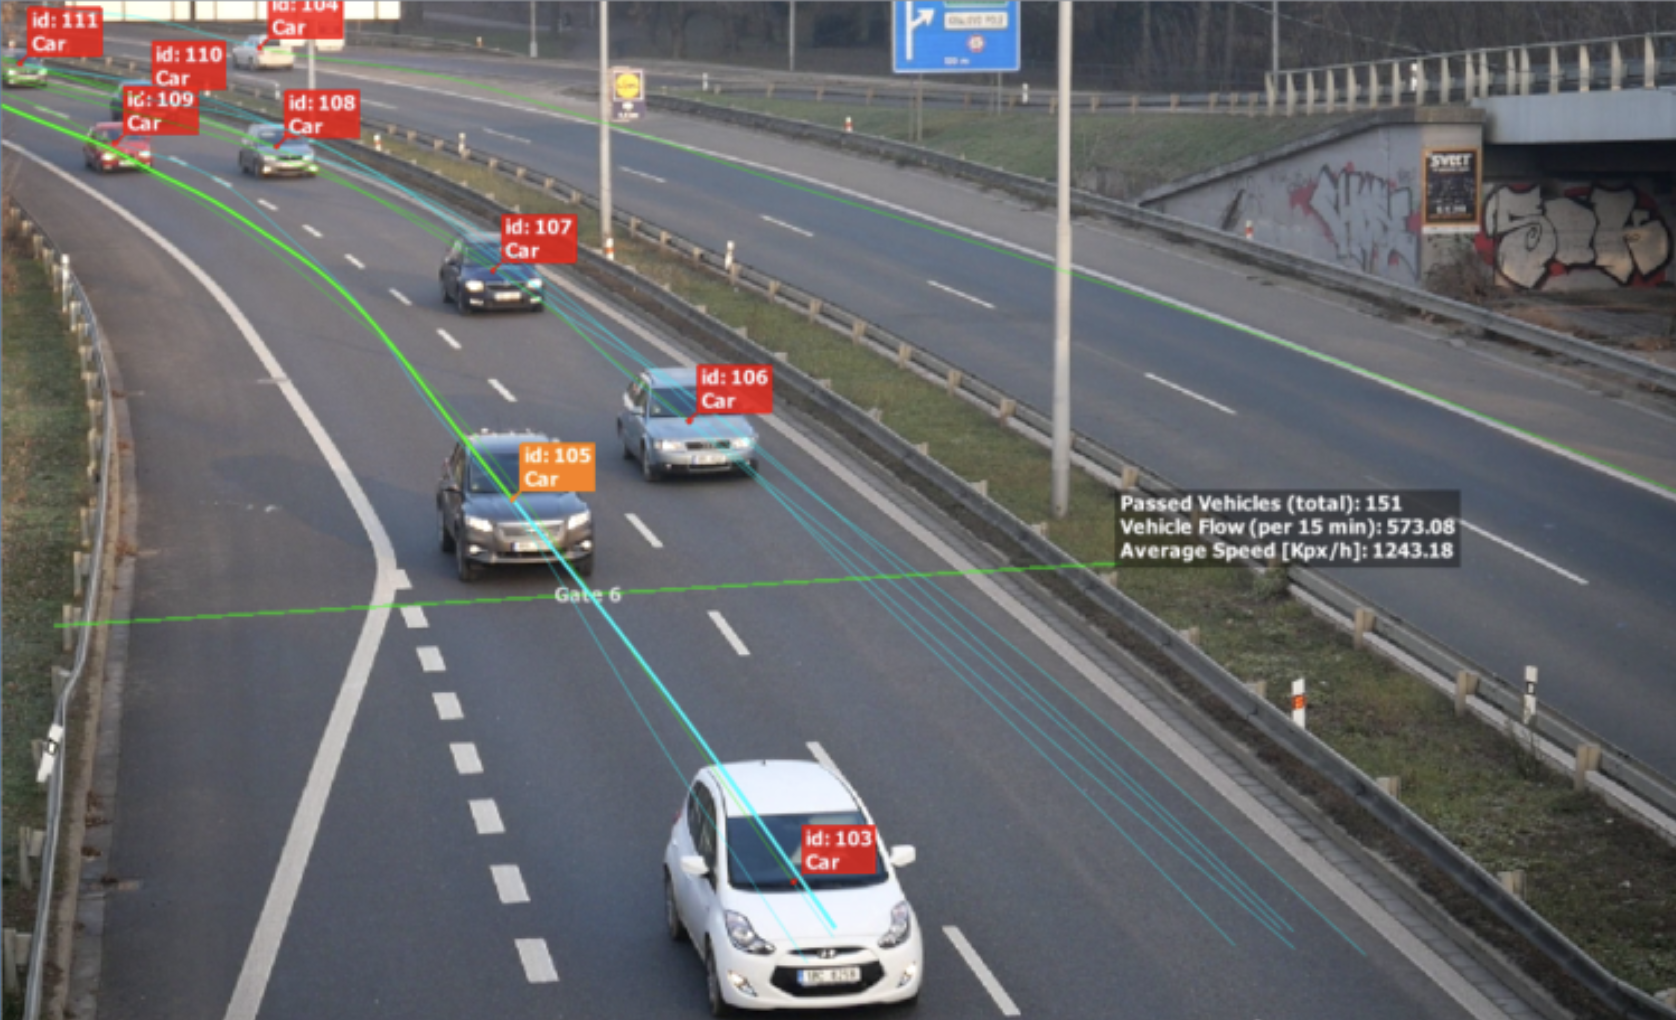
Visualize traffic volumes by class and time of day.

Exportable charts and graphics built for stakeholder review.
Manual counts miss context. Site visits burn hours. Decisions get delayed.
We fix that with standardized drone mobility studies.

Hidden Risks → Near-misses and unsafe movements go unseen in manual counts.

Wasted Time → Site visits and manual logs delay projects.

Burned Budgets → Inconsistent methods across sites waste dollars.


Understand traffic volume, turning movements, and behavior before investing capital.
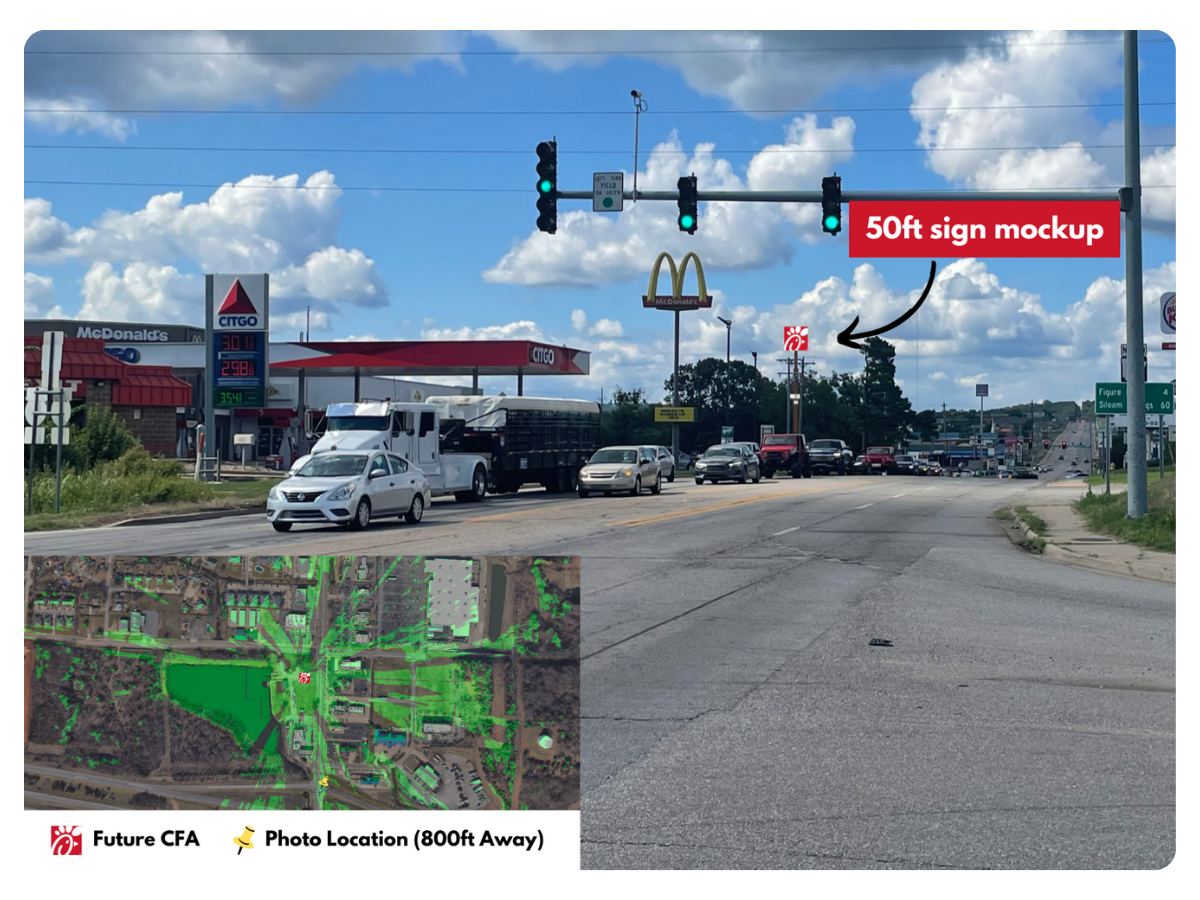
See Example Project →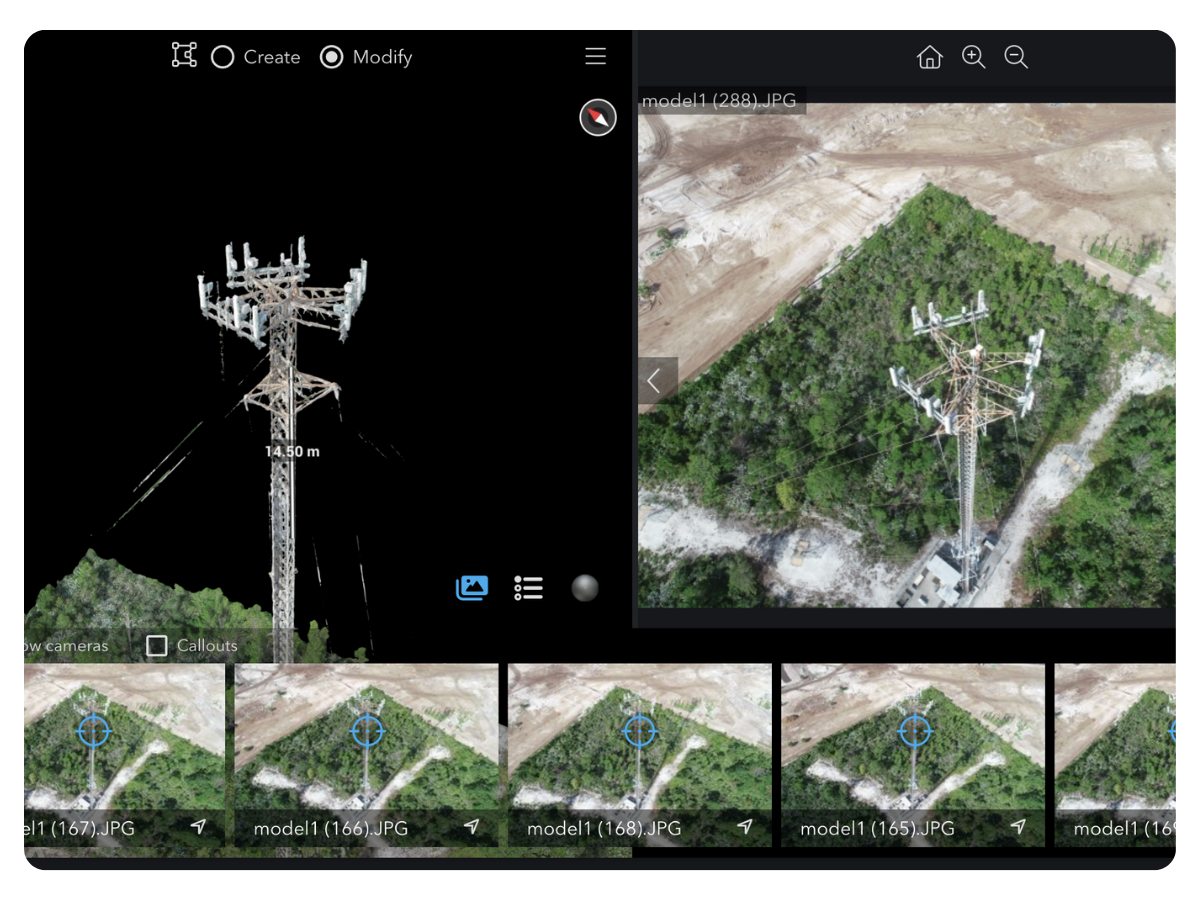
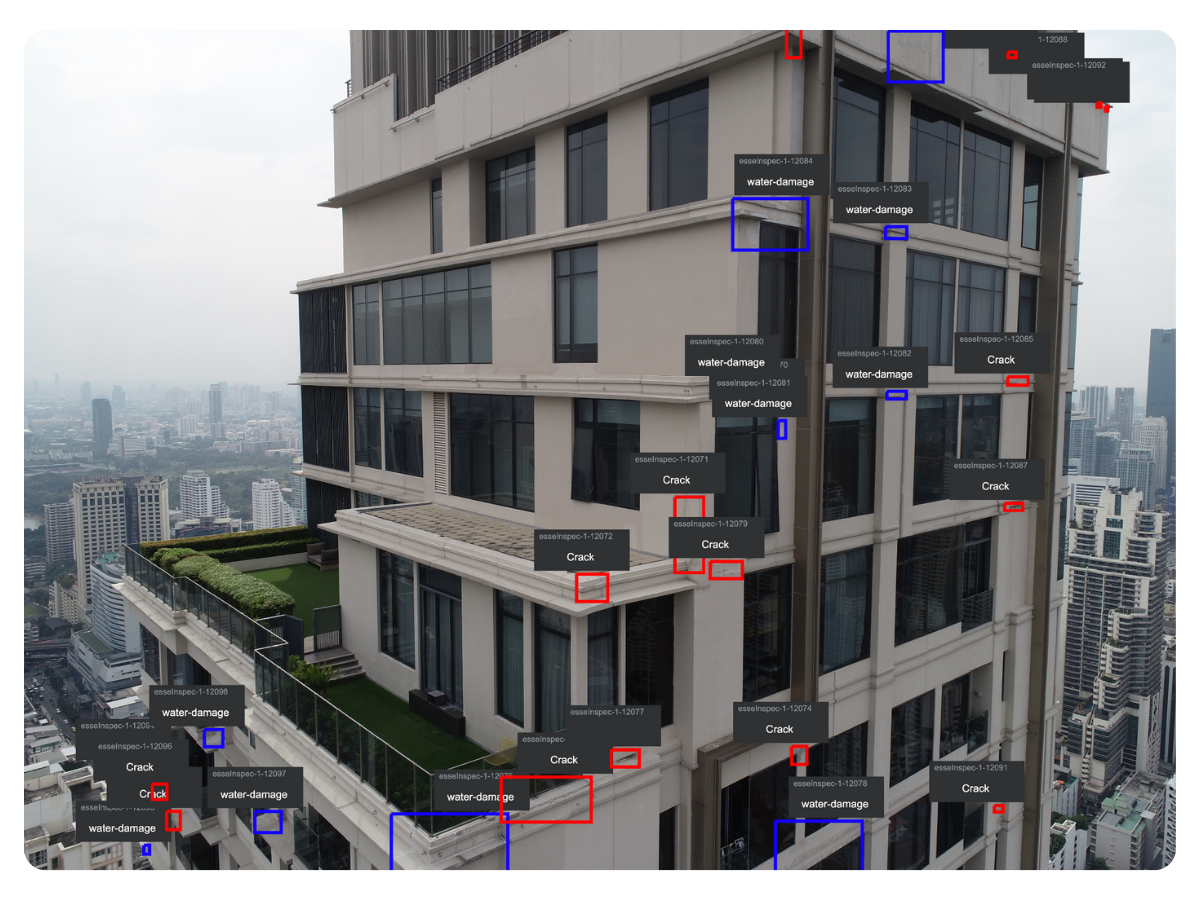
Prevent outages and failed installs with accurate, inspection-grade tower data.
Request Tower Data →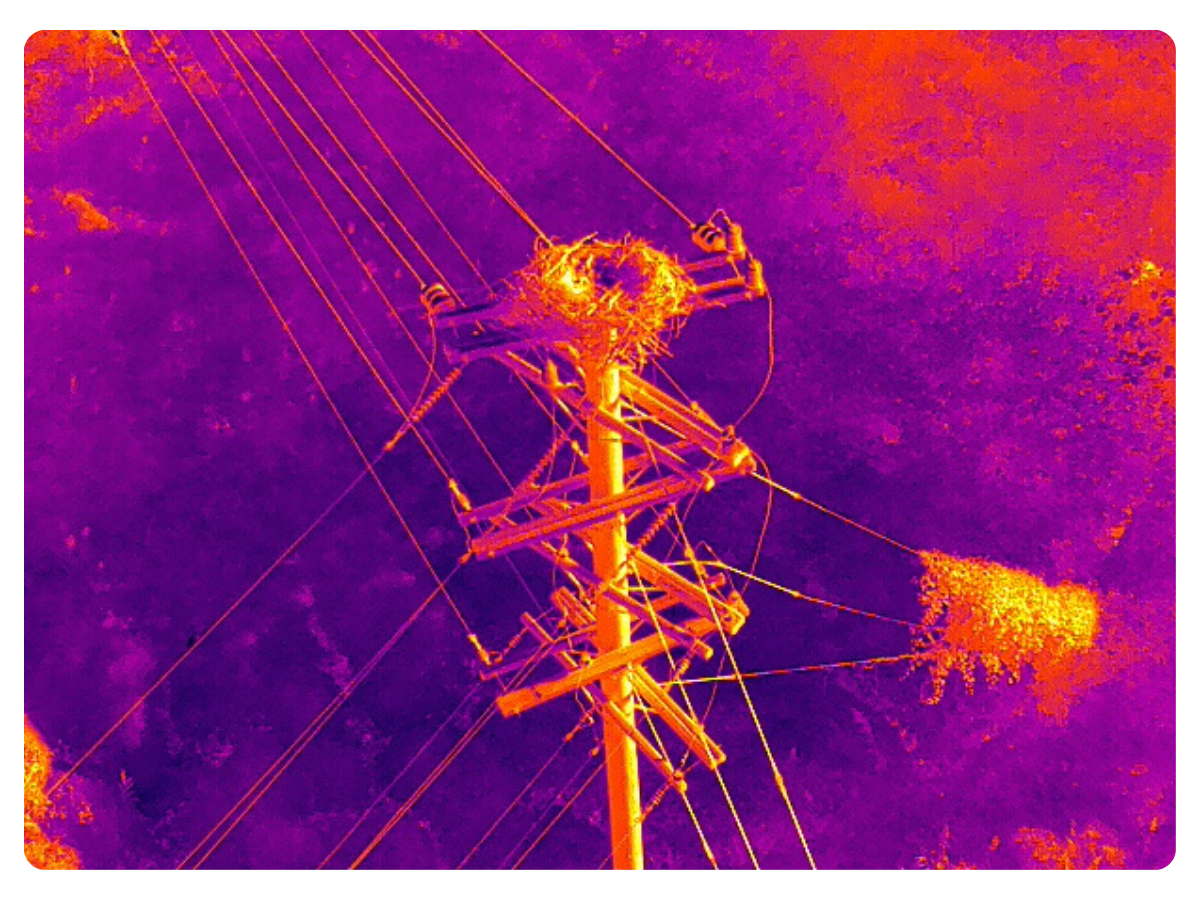
Find defects and clearance risks early to avoid outages and emergency repairs.
Request Pole Data →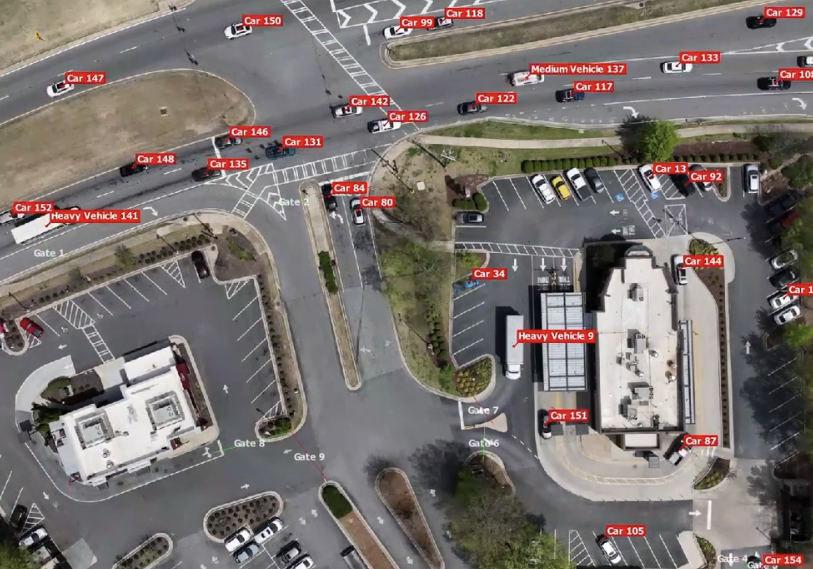


.png)